
Mildew, Jensen (1996)
In this example, a farmer has to decide on the treatment of a wheat field. Two months before harvest of a wheat field he observes the state of the crop and he observes whether it has been attacked by mildew. If there is an attack he should decide on a level of treatment with fungicides to eliminate the mildew attack.
The domain of this problem is modeled by the (limited-memory) influence diagram (LIMID) in Figure 1. Note the links from the observations to Decision. They specify that when the treatment decision has to be made, the states of the two variables are known to the farmer. If these links are not specified, the computations will be made under the assumption that these observations are not known by the farmer when he has to make the treatment decision.
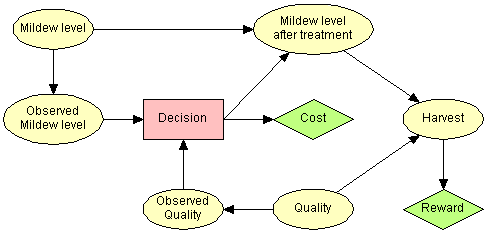
Figure 1: The Mildew problem as an influence diagram.
Figure 1 above shows the Mildew problem as an influence diagram. Assume the uncertainty and utility of the decision problem can be expressed as the conditional probability distributions as defined in this HUGIN network specification file. The quantification is made for demonstration purposes only.
The profit (or loss) made by the farmer depends on the quality of the decision he makes. Solving the decision problem is a question of weighing the costs and rewards with the probability distributions specifying the uncertainty in the decision problem under the assumption that the decision maker tries to optimize the expected utility. The table below shows the expected cost and reward made by the farmer when he adheres to the (optimal) strategy identified by solving the influence diagram representation shown above.
Expected Cost and Reward
| Expected Utility | |
| Cost | |
| Reward | |
| Cost + Reward |
The table below shows the probability distribution over the harvest node. The probability distribution changes when observations on the level of mildew attack and observed quality are obtained.
Harvest
| State | Probability | Expected Utility |
| Rotten | ||
| Bad | ||
| Poor | ||
| Fair | ||
| Average | ||
| Good | ||
| Very Good |
The decision considered by the farmer is whether or not to and how much to treat the wheat field before harvesting.
Enter the actual decision on treatment below to investigate the expected impact on the harvest and cost-benefit.
| Observed Mildew level | |
| Observed Quality |
The decision considered by the farmer is whether or not to and how much to treat the wheat field before harvesting.
Enter the actual decision on treatment below to investigate the expected impact on the harvest and cost-benefit.
Treatment Decision
The expected utility of the decision options and the probability of each option under the (optimal) strategy identified is shown below. The latter is the probability of the treatment decision when no observations are entered and it changes as observations and the decision are made. Thus, initially there is 70.59% probability that the farmer will not treat with fungicides.
| Treatment Decision Option | Expected Utility | Probability |
| No treatment | ||
| Low | ||
| Mild | ||
| Severe |
Enter the actual decision below (and see the expected utility in the table above)
Treatment Decision: